

Bake-off: comparing Excel vs. Guac for grocery demand forecasting
In this blog post, we dive deep into the demand forecasting process and actually show you a head to head comparison between our ML algorithm and Excel forecasting.
In the dynamic world of grocery supply chain operations and inventory management, accurate demand forecasting is incredibly important — over-prediction creates food waste and under-prediction means losing potential revenue.
In our last blog post, we discussed why grocery demand forecasting in particular is so difficult, and how our algorithm uses machine learning to address the challenges that Excel and other simple demand forecasting methods face.
In this blog post, we want to dive deep into the demand forecasting process and actually show you a head to head comparison between our ML algorithm and Excel forecasting.
Excel Forecasting
Traditionally, the tool of choice for demand forecasting is often Excel: inventory planners will look at spreadsheets of historical sales data to estimate how much they’ll sell in the future.
Specifically, one customer told us that they take an average of 1. last week and 2. the week before’s sales to forecast future demand for the upcoming week. In other words, they used a formula like this on Excel:

So we tried it out on predicting some daily total store sales.
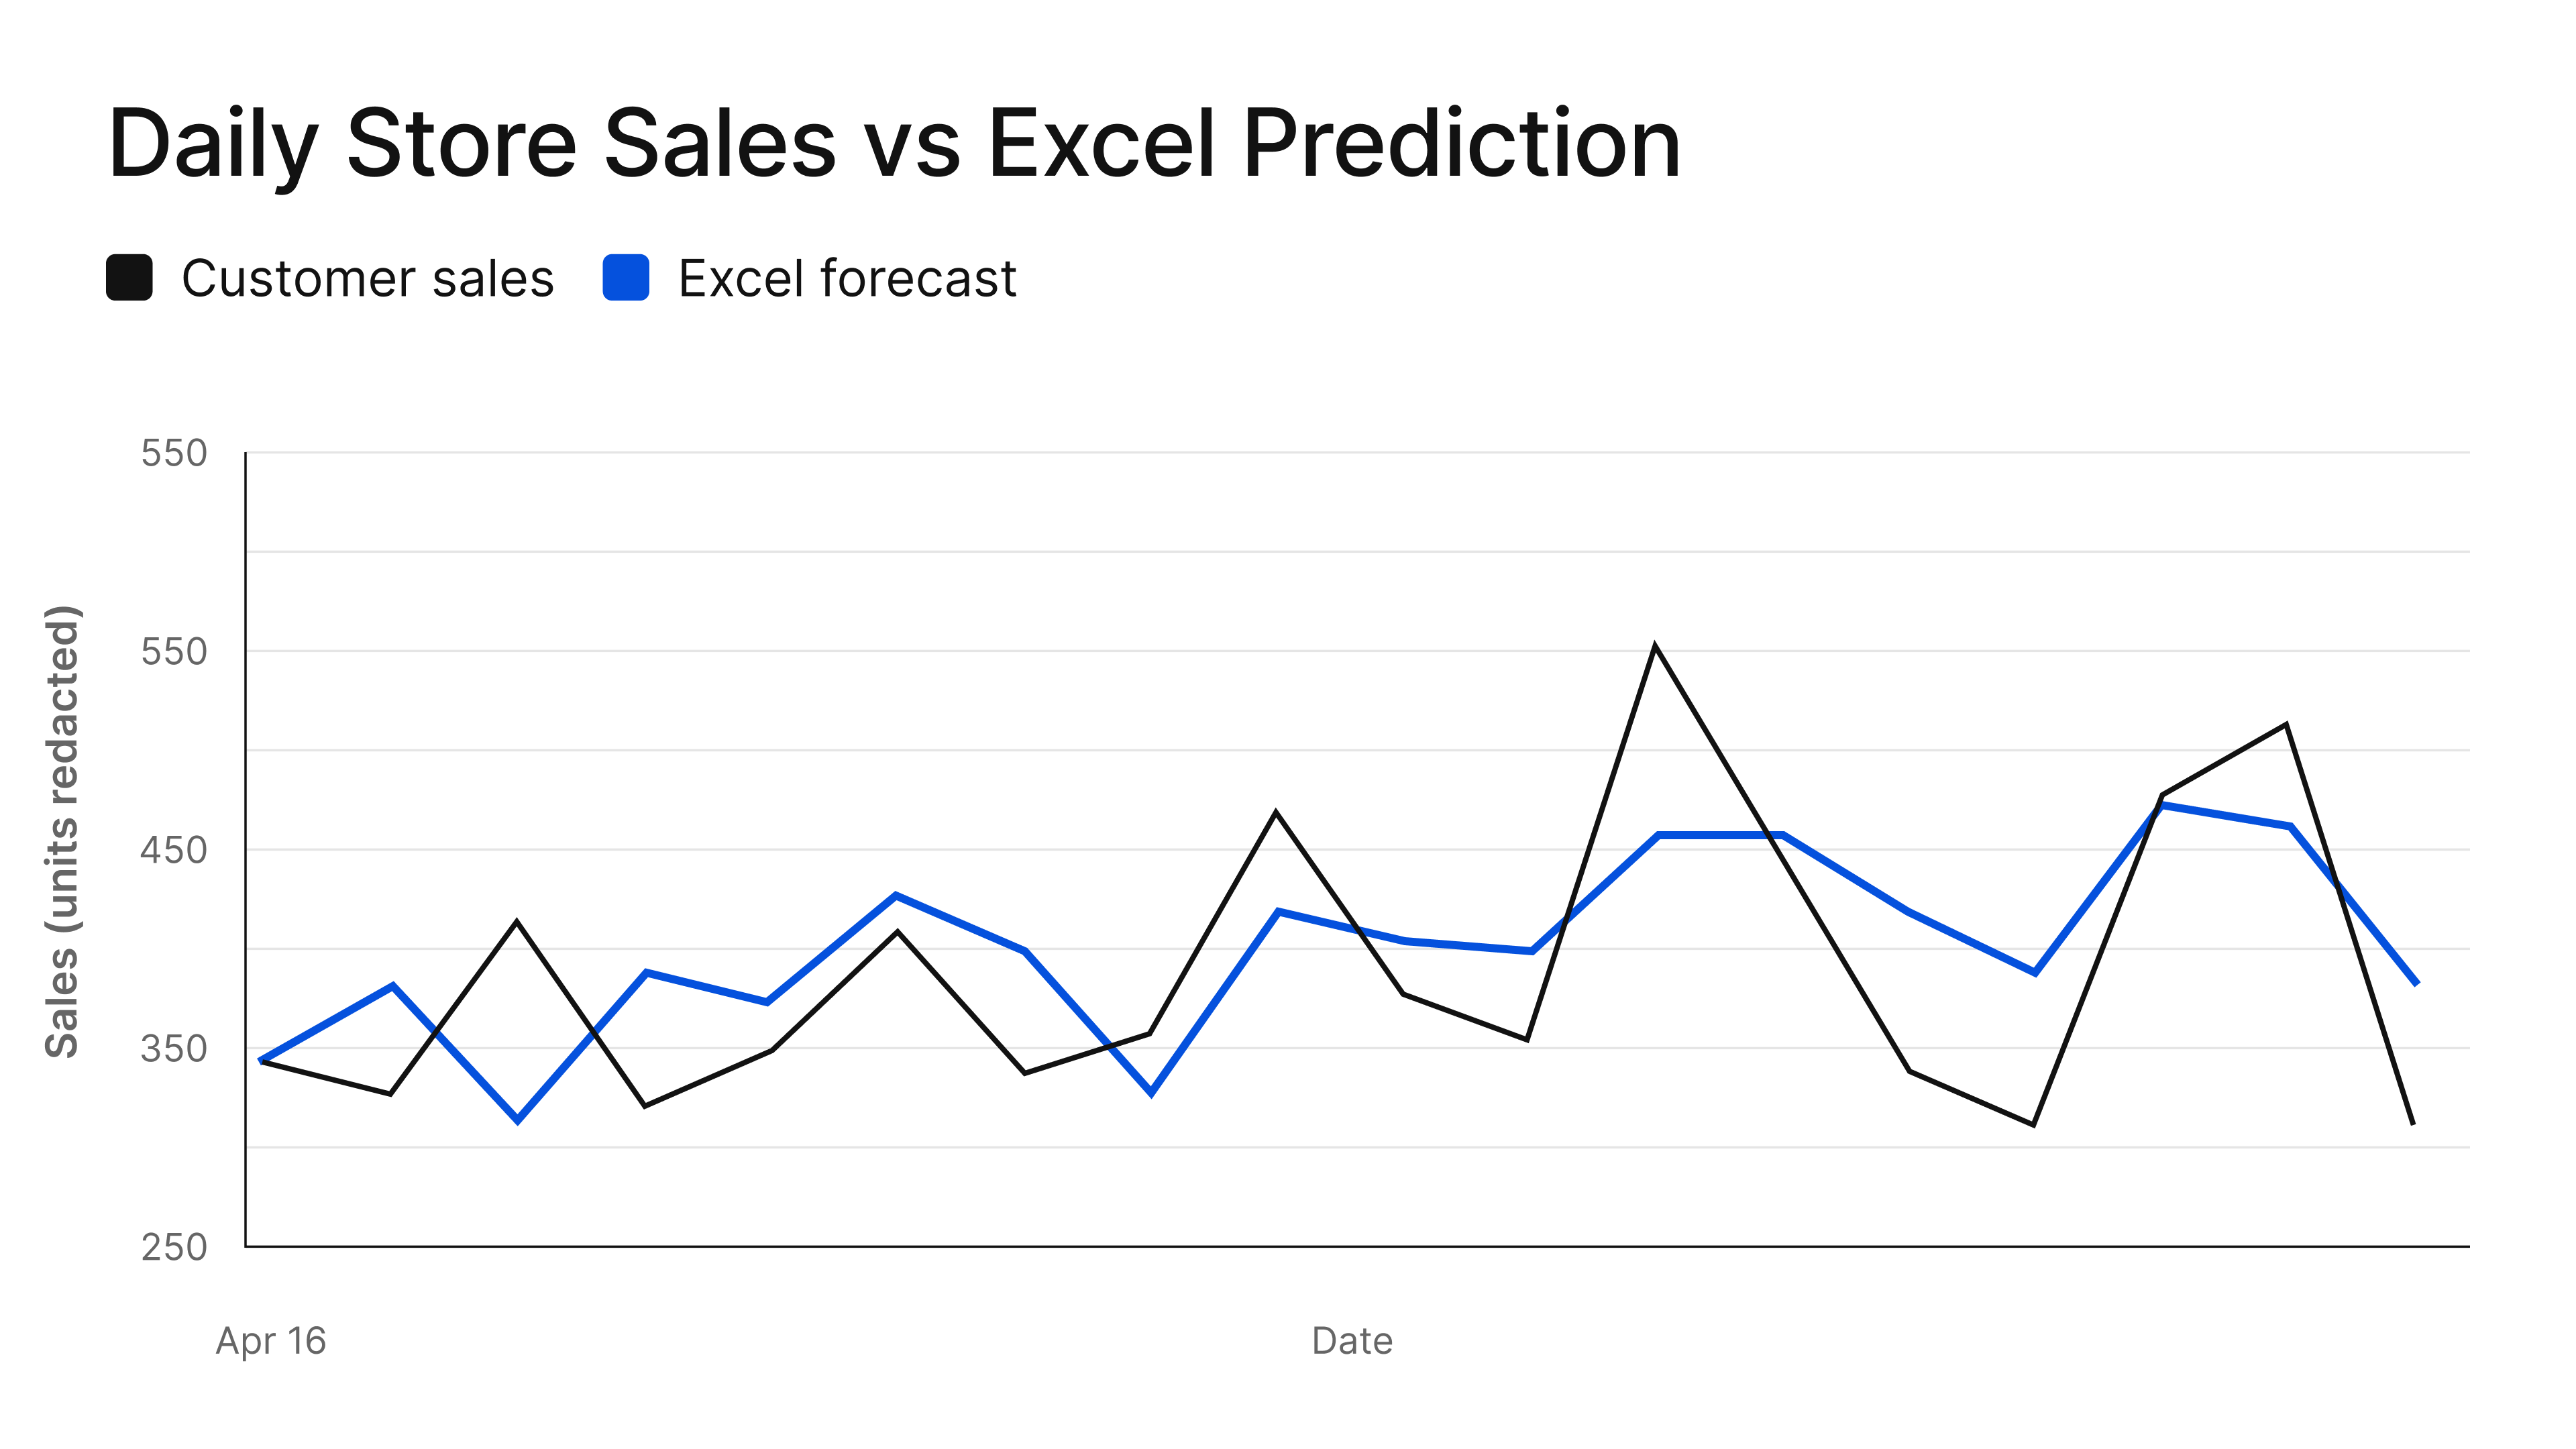
On some days, the Excel model over-predicted. Especially for the week after April 16th, the general over-prediction was because local schools were on vacation during the two previous weeks, which increased sales. When students returned to school on April 17th, sales were lower than the weeks before, but the Excel model didn’t realize it needed to compensate for this change.
Why is grocery demand impossible to predict using Excel?
Grocery demand is wildly inconsistent week-to-week and it changes based on hundreds of factors that happen in the real world. For example, last Wednesday might have been a school holiday with cold weather; whereas this Wednesday might have an important sports game and really warm weather.
If you’re only looking at last Wednesday’s sales to predict this Wednesday’s sales, all of those variables get missed. The problem with Excel is that it’s impossible to consistently and accurately incorporate these hundreds of demand drivers in a single spreadsheet.
Guac’s Demand Forecasting Model
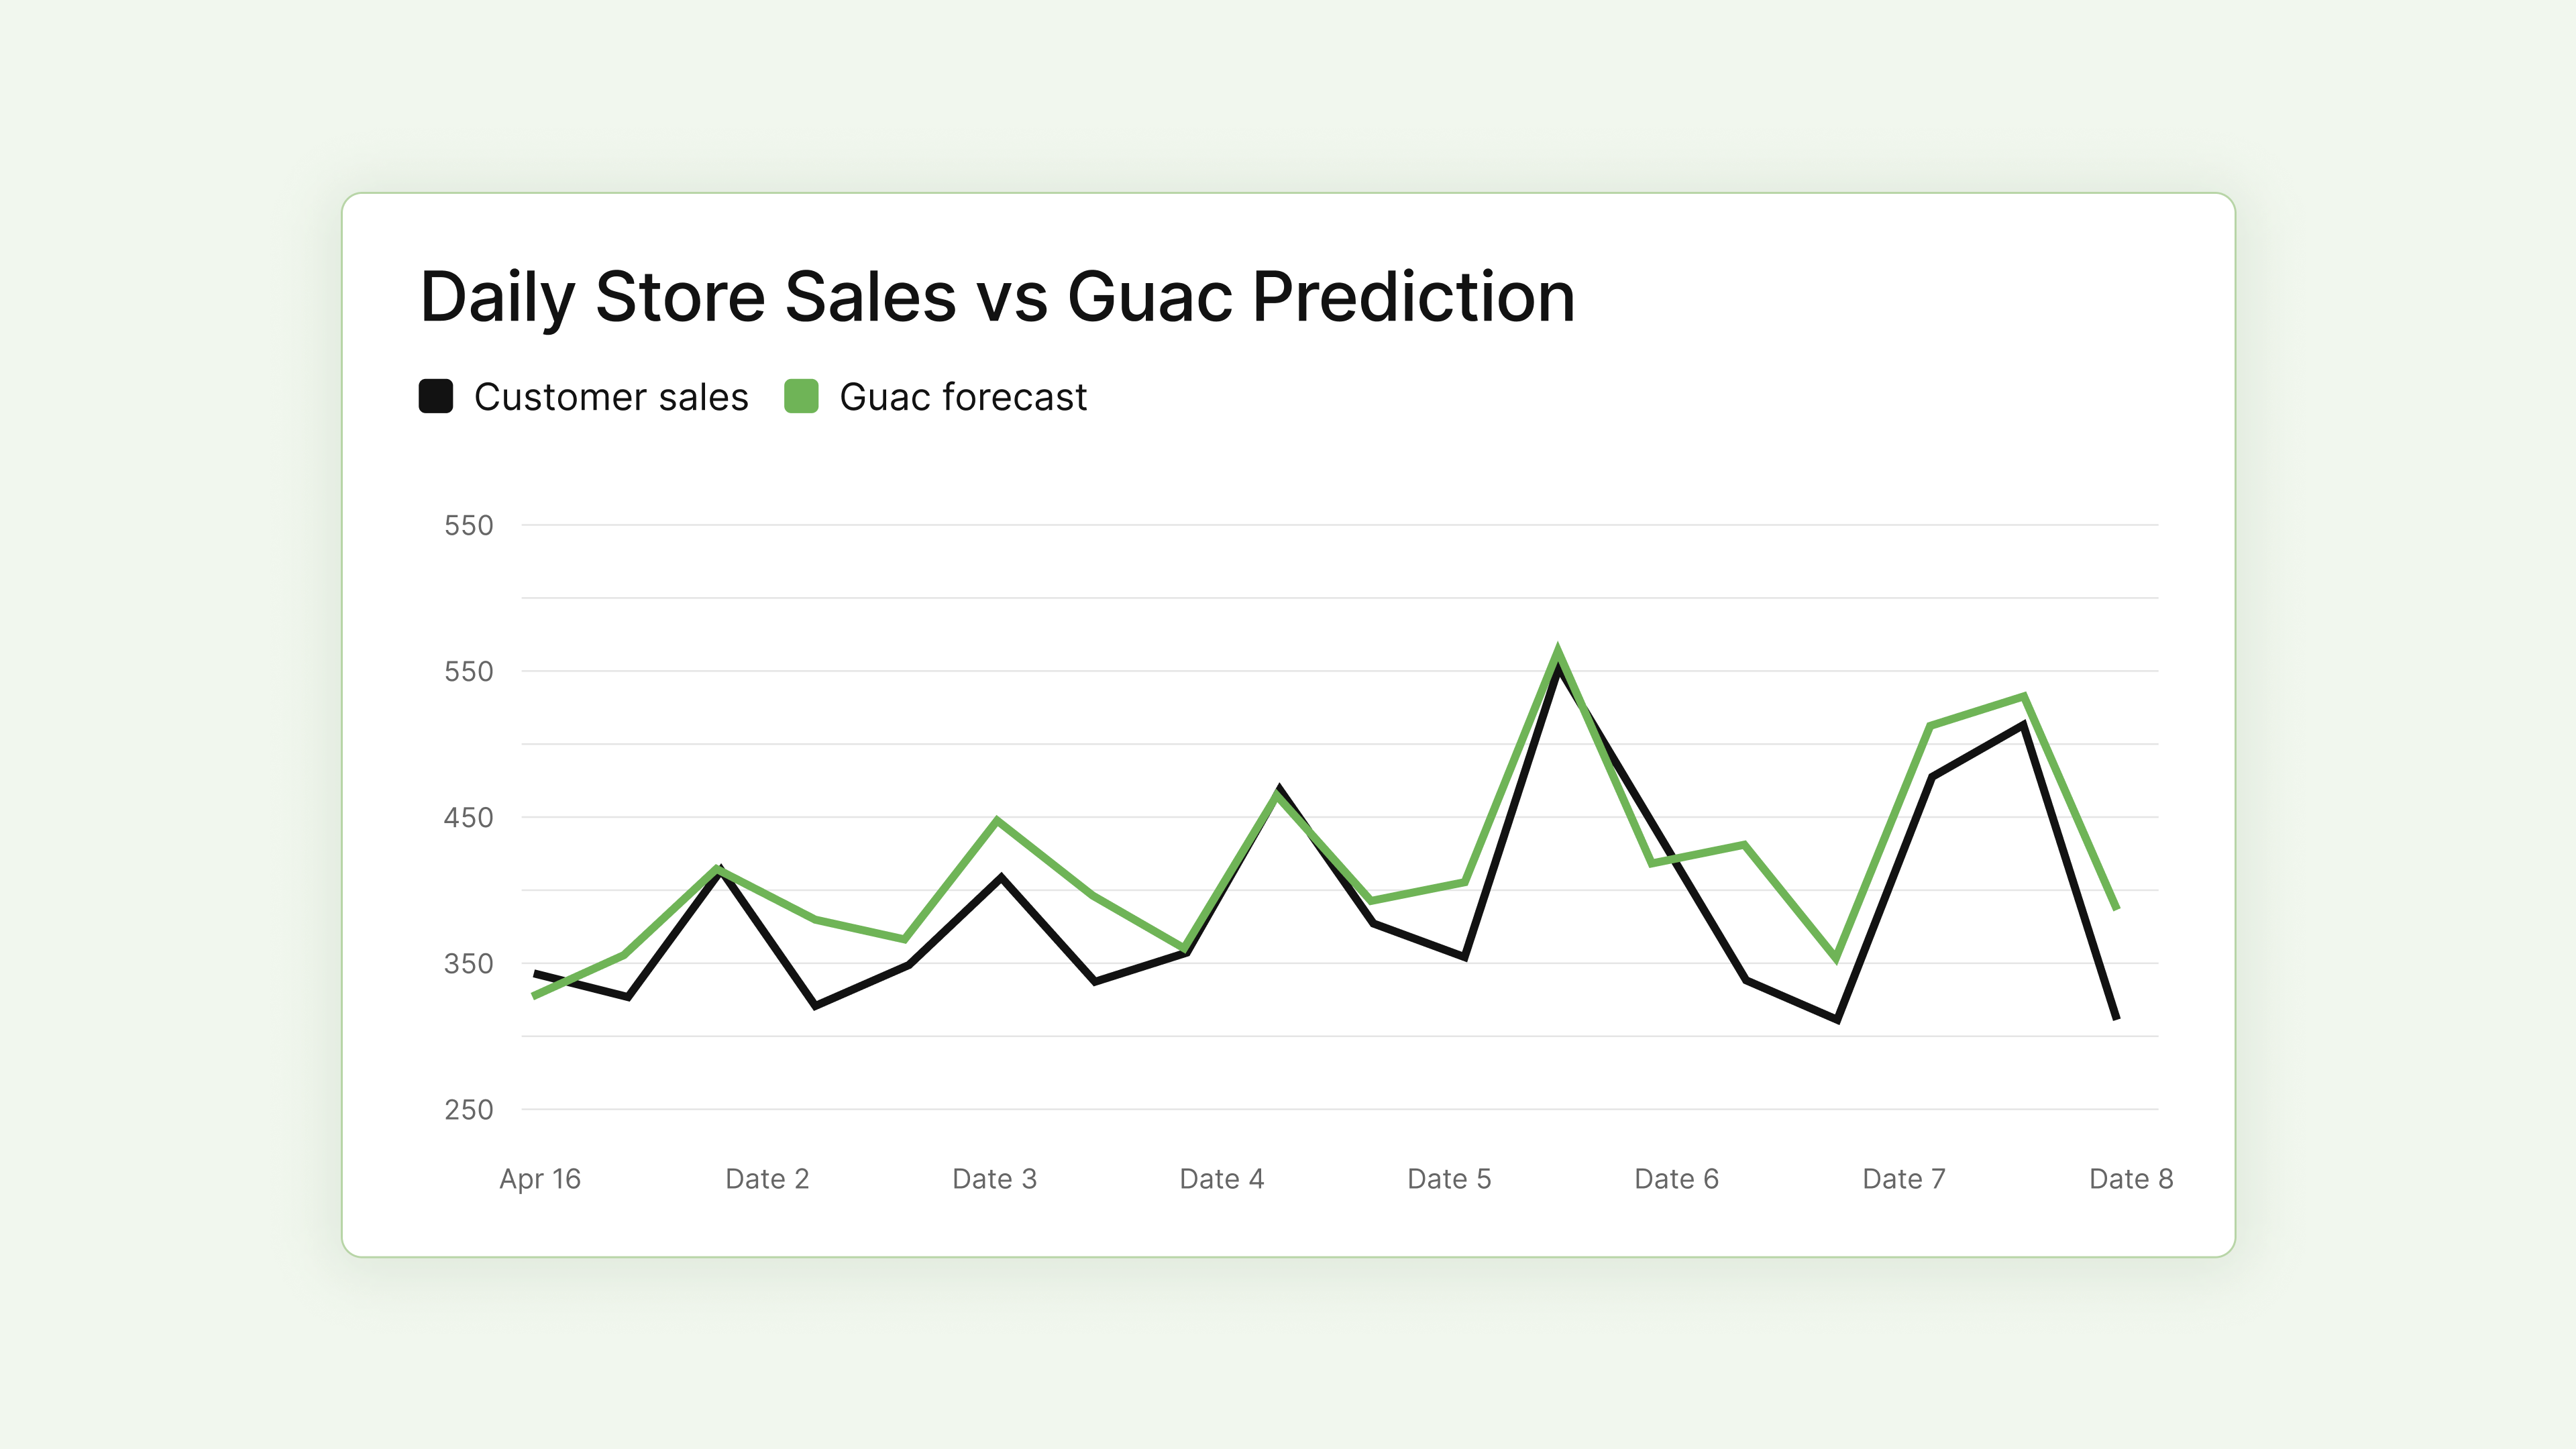
Let’s look at how our ML algorithm performs for the same sample period. With machine learning, we can actually capture thousands of data points and identify causal patterns between external variables and grocery sales.
For this algorithm, we added in past sales data, but also everything from weather forecasts, predicted sports viewership, local events, school vacation dates, market conditions, area demographics, product promotions, and more, to produce this graph:
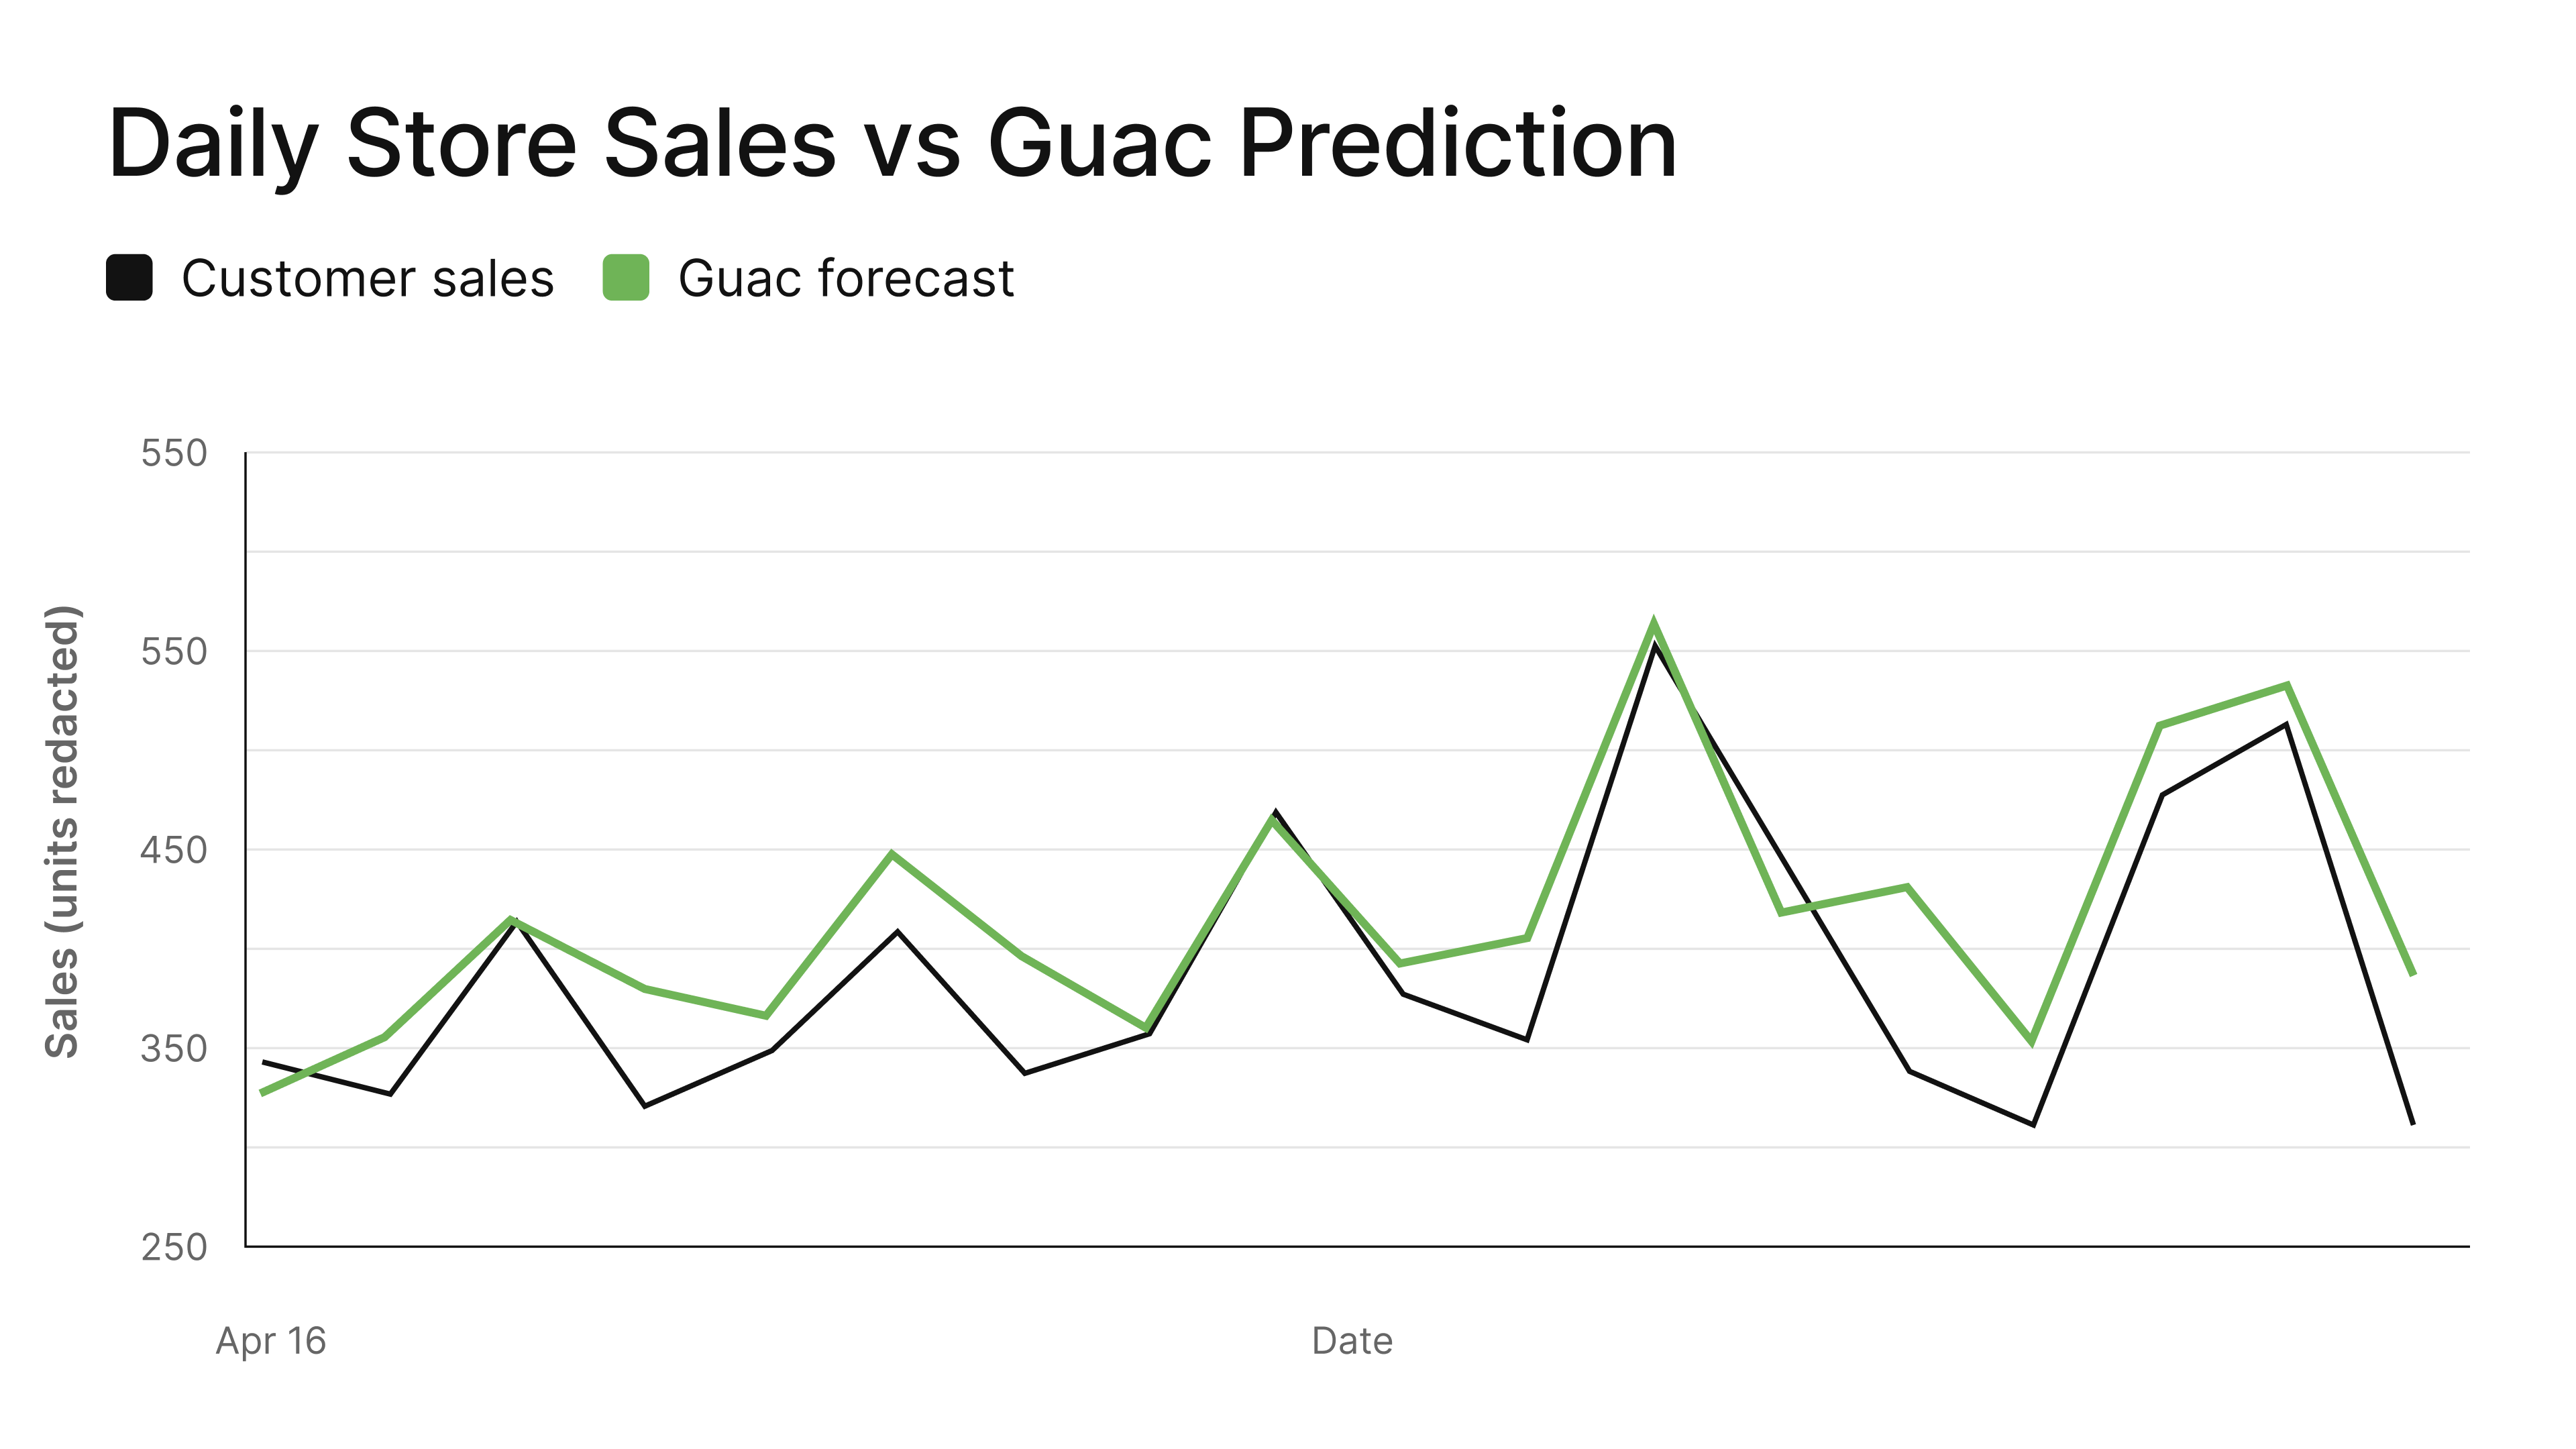
Because our algorithm incorporates the underlying variables that are behind the large peaks and troughs in actual demand, we’re able to accurately predict these demand changes.
It’s not just about using ML; it’s really about external variables
The key difference in our algorithm isn’t just that we use machine learning models instead of using Excel; it’s that we incorporate hundreds of external data points like weather and sports events, which machine learning enables us to do — that allows us to be so much better than Excel.
In our next blog, we’ll actually show you how our algorithm outperforms grocery data teams already using machine learning — and why it’s not enough to just use machine learning models, without incorporating external data points.
Related Articles
How many avocados are going to sell next Tuesday?
Grocers have to predict the future every day: they order new inventory based on what they predict their future demand will look like.

